X-Ray 1.0.4.1, my Bachelor and Research Project
X-Ray is an open-source software visualization plug-in for the Eclipse framework. It is my bachelor project and thesis, as far as my research topic, supervised by Prof. Dr. Michele Lanza and Dipl. Ing. Mircea Lungu. It provides System Complexity View, Class and Package Dependency View for a given Java project. Moreover, its model of the underlying Java project can be triggered and used by other plug-ins (there will be soon a tutorial about that).
How to Download and Install X-Ray
X-Ray relies on GEF and they must be decompressed inside the "plugin" folder of Eclipse (GEF has some metadata that goes outside this folder).
- Install the GEF framework plug-in and metadata (required by some of the graphics)
- Install the X-Ray plug-in (unzip and put the jar file inside the plugin folder of Eclipse). Please notice that the source code is inside the jar file.
23675 users have downloaded X-Ray so far! Rate this plug-in!
Please contact me bofore using it for commercial purposes.
X-Ray scales up, at least to a certain, acceptable, degree. It can be successfully used to analyze and understand pretty big projects.
Unfortunately I didn't have the time to create a working feature that allows you to download and update the plug-in through Eclipse, yet.
Version 1.0.4.1 provides:
- External interfaces are now modeled
- A bug in the creation of the model has been fixed
- Faster model
- Less memory footprint
- Model accessible from other plug-ins (tutorial *really* soon..)
- Progress bar giving information about the model construction
You can download my thesis and the poster of the plug-in (be aware that they both refer to the first version of the plug-in).
Abstract
Software is inherently intangible. Systems can be composed of a huge amount of software entities linked together by different kinds of dependencies. Software designers use visualization tools in order to raise the level of abstraction and reduce the amount of information to the one needed. Most of these tools are stand-alone programs, that force the user to switch between different windows and contexts. This context switch represents a problem, being time consuming and forcing the user to download, install and use, tools or systems external to his favorite code editor. Developing an open-source software visualization plug-in for the Eclipse framework represents a significant step towards bringing the visualization tools in the forward engineering process.
How to use it
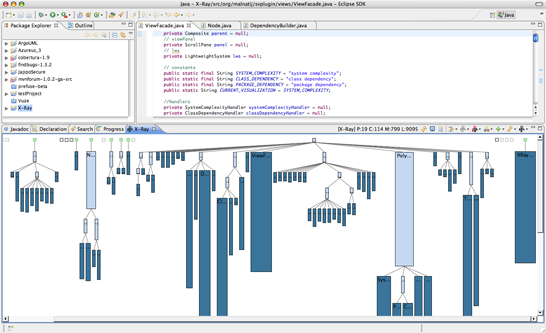
Once X-Ray has been installed, close and open again Eclipse (if it was previously executing). The plug-in adds an action that will be visible after right-clicking on a project in the Package Explorer. Right-clicking on a project and left-clicking on Analyze Current Project action, X-Ray will be fully loaded and activated. Its core will parse and analyze the sources of the selected project and create an internal code representation for the underlying Java code. X-Ray will then create and show its view containing the System Complexity View of the whole selected project.
So far the process of creating the internal code representation is still bound to the UI thread of Eclipse, therefore during this process the user interface of Eclipse will not be responding. In the next release the task of creating the internal code representation will be performed by an external job.
Project's Information and Available Actions
The X-Ray workbench view (the view created by the plug-in) provides general textual information about the project and different actions to the user. Some actions are available for every polymetric view, while others are specific to certain visualizations. Available actions are associated with colored icons, while unavailable ones have gray-scaled icons.
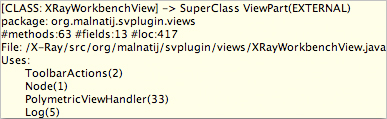
Inside its workbench view the plug-in will show to the user different visualizations, each of them providing a different abstraction. Every visualization is characterized by entities positioned according to different layouts and criterions and the user will be able, by left-clicking on an entity, to select it; a red border indicates that the node (in this context node is a synonym of entity or vertex, given that entities are shown as nodes in a tree or vertexes in a graph) is selected and every action that requires a selection (as shown later) will be applied to the currently selected node (or set of nodes). The plug-in can even highlight nodes (with a green border), while they are useful for a particular view or action. Every node (and even some kind of edge) has a tooltip that describes the nature and content of that item.
More about Actions..
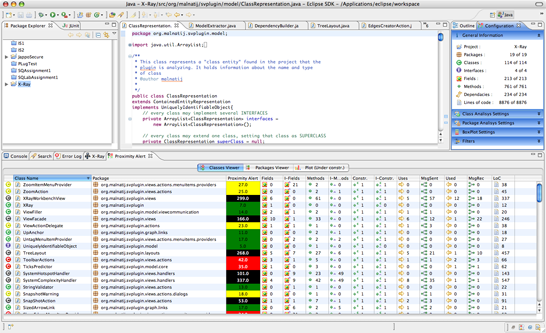
As soon as the internal code representation has been computed, X-Ray will update the textual description of the project inside its workbench view, providing information about the name, the number of packages, the number of classes, methods and lines of code in the following format: [Project-Name] P:#packages C:#classes M:#methods L:#lines-of-code. This description, despite being short, gives to the user a first and quick overview of the project's architecture.
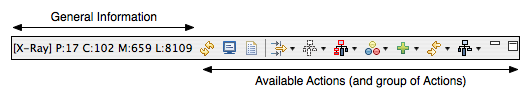
The screenshot above has been captured while X-Ray was analyzing itself, therefore the general informations, in the left part of the image, are related to the architecture of the plug-in itself. The current version has 17 packages, 102 classes, 659 methods and 8109 lines of code.
On the right part there are 10 colored icons that are bound to 10 actions or group of actions. The following is a quick description for each action:
 Refresh Action: Refreshes the current visualization. The plug-in will parse and analyze
again the whole project, therefore it might be an intensive task. (Be aware that
in the actual version, 1.0.3, refreshing implies to build the internal code representation from scratch
and this could, potentially, require a lot of time. In the next release the refresh action will
exploit the incremental internal code representation that I am implementing right now).
Refresh Action: Refreshes the current visualization. The plug-in will parse and analyze
again the whole project, therefore it might be an intensive task. (Be aware that
in the actual version, 1.0.3, refreshing implies to build the internal code representation from scratch
and this could, potentially, require a lot of time. In the next release the refresh action will
exploit the incremental internal code representation that I am implementing right now).
 Snapshot Action: Takes a screenshot of the current visualization and saves it as a
jpeg image on the user’s Desktop. This is particularly useful when users want to share their analysis.
Snapshot Action: Takes a screenshot of the current visualization and saves it as a
jpeg image on the user’s Desktop. This is particularly useful when users want to share their analysis.
 Open Selected Classes: The plug-in will open the .java files corresponding to the
classes represented by the selected entities inside the source code editor provided by
the Eclipse framework. This action will also trigger the Show Dependencies Action,
if available in the current visualization.
Open Selected Classes: The plug-in will open the .java files corresponding to the
classes represented by the selected entities inside the source code editor provided by
the Eclipse framework. This action will also trigger the Show Dependencies Action,
if available in the current visualization.
 Show/Hide Package Content (group): this action will show a new menu where the user can create filters to hide or show entities
belonging to (or being) one or more packages, as follows:
Show/Hide Package Content (group): this action will show a new menu where the user can create filters to hide or show entities
belonging to (or being) one or more packages, as follows:
 Show all Packages' Content: this action will allow the user to see all the entities in the current project (the default visualization).
 Package Content as Regular Expression: this action will allow the user to see all the entities in the
current project contained in (or being) the packages matching the regular expression that he/she can enter in the
text-field provided by the panel created by this action.
Package Content as Regular Expression: this action will allow the user to see all the entities in the
current project contained in (or being) the packages matching the regular expression that he/she can enter in the
text-field provided by the panel created by this action.
Single Package Content: this action will show only the entities in the package selected by the user (that will browse and select it
in the list provided by the plug-in).
 Single Package Hidden: this action will hide only the entities in the package selected by the user (that will browse and select it
in the list provided by the plug-in).
Single Package Hidden: this action will hide only the entities in the package selected by the user (that will browse and select it
in the list provided by the plug-in).
 Show/Hide Nodes (group): this action group will show a new menu where the user can chose to hide the currently
selected nodes (and children) or show all the previously hidden entities. (In the next release the user will have
more power in selecting which entity should be shown after being set as hidden).
Show/Hide Nodes (group): this action group will show a new menu where the user can chose to hide the currently
selected nodes (and children) or show all the previously hidden entities. (In the next release the user will have
more power in selecting which entity should be shown after being set as hidden).
 Selection (group): the user can directly select an entity by left-clicking on it (So far, the user cannot directly
select more than one entity at a time due to some cross-platform issues that the next release will fix).
This group of actions provide a way to select multiple entities depending on different criterion and entities property.
Selection (group): the user can directly select an entity by left-clicking on it (So far, the user cannot directly
select more than one entity at a time due to some cross-platform issues that the next release will fix).
This group of actions provide a way to select multiple entities depending on different criterion and entities property.
Regular Expression Selection: will prompt a panel in which the user can enter a regular expression that will be
matched against the names of all the entities in the current visualization.
 Select all Nodes: selects all the entities in the view.
 Invert Selection: inverts the current selection (selected entities will be deselected and vice-versa).
 Select all Highlighted Nodes: selects all the entities that are currently highlighted (highlighting is done automatically by
the plug-in as result of some actions).
Select all Highlighted Nodes: selects all the entities that are currently highlighted (highlighting is done automatically by
the plug-in as result of some actions).
 Select by Kind..: this action will prompt a new action menu where the user can choose which kind of class node
to select: abstract, concrete, interface, external. It also provide a mechanism to deselect them.
Select by Kind..: this action will prompt a new action menu where the user can choose which kind of class node
to select: abstract, concrete, interface, external. It also provide a mechanism to deselect them.
 Select by Color Tag..: prompts a new menu where the user can select or deselect all the entities of a given color.
Select by Hierarchy..: prompts a new menu where the user can select or deselect entities by their hierarchies: parents,
children, siblings.
 Select by Hierarchy Position..: prompts a new menu where the user can select or deselect
entities by their hierarchies positions: leafs,
roots, branches.
Select by Hierarchy Position..: prompts a new menu where the user can select or deselect
entities by their hierarchies positions: leafs,
roots, branches.
Color Tag (group): provides a way to color tag all the selected entities. Adding a color to a set of entities is extremely useful
while sharing information or grouping nodes based on some criterion. So far, it is possible to tag with 4 different colors.
The following is a simple example.
 Orange Color Tag: add an orange border to the selected entities.
 Remove All Orange Color Tags: remove all the orange borders from the whole visualization.
 Black Color Tag: reset the color of the border of the selected entities
(black border is the default one, which implies no color tagging).
Black Color Tag: reset the color of the border of the selected entities
(black border is the default one, which implies no color tagging).
 Remove All Color Tag: removes all the color tags from every entity
 Zoom (group): this group is responsible for modifying the size of the entities shown in the current polymetric view as follows:
Zoom In: increases the size of every entity in the current visualization.
 Zoom Out: decreases the size of every entity in the current visualization.
 Manual Zooming: increases or decreases the size of every entity in the current visualization, according to the input of the user.
This action will prompt a panel where the user can enter in a text field a real number such that the current size of every entity will be
adjusted according to that coefficient. (I.E. 0.5 will decrease by half the size of every entity, while 1.5 will double it).
Manual Zooming: increases or decreases the size of every entity in the current visualization, according to the input of the user.
This action will prompt a panel where the user can enter in a text field a real number such that the current size of every entity will be
adjusted according to that coefficient. (I.E. 0.5 will decrease by half the size of every entity, while 1.5 will double it).
 Fit to Screen: X-Ray will try to reduce/increase the size of the entities of the view such that the whole visualization
will be shown without requiring horizontal scrolling, fitting the current workbench view dimensions.
Fit to Screen: X-Ray will try to reduce/increase the size of the entities of the view such that the whole visualization
will be shown without requiring horizontal scrolling, fitting the current workbench view dimensions.
 Restore Default Size: restores the dimension of every entity to the original one.
 Show Dependencies and Interfaces links (group): Through this group the user will be able to overlay to the current
view edges (arrows) between the selected class node and its dependencies (in terms of method calls). It will also be
able to track interfaces implementation and apply filters to the set of dependency edges.
Dependency Edges are colored arrows, they range from light pink to bright red. The more red, the heavier is the dependency. Every
edge has a tooltip containing its source, target and weight. Interface edges are green edges.
Every time X-Ray creates an edge between a selected node and another one,
the not-previously-selected node will be highlighted with a light and bright green border.
The group works as follows:
Show Dependencies and Interfaces links (group): Through this group the user will be able to overlay to the current
view edges (arrows) between the selected class node and its dependencies (in terms of method calls). It will also be
able to track interfaces implementation and apply filters to the set of dependency edges.
Dependency Edges are colored arrows, they range from light pink to bright red. The more red, the heavier is the dependency. Every
edge has a tooltip containing its source, target and weight. Interface edges are green edges.
Every time X-Ray creates an edge between a selected node and another one,
the not-previously-selected node will be highlighted with a light and bright green border.
The group works as follows:
 Show Outgoing Dependency Edges: this action will overlay to the current visualization all the outgoing
dependencies, given a set of class nodes. It will therefore connect every class node that has one
or more methods used by the selected class(es). It just works in the System Complexity View, given that the
other polymetric views already contain this information.
Show Outgoing Dependency Edges: this action will overlay to the current visualization all the outgoing
dependencies, given a set of class nodes. It will therefore connect every class node that has one
or more methods used by the selected class(es). It just works in the System Complexity View, given that the
other polymetric views already contain this information. Show Incoming Dependency Edges: this action works like the previous one, except that here the
dependencies are the incoming ones, that is: there will be an arrow from every class that uses
some method implemented in the selected class(es). It just works in the System Complexity View, given that the
other polymetric views already contain this information.
Show Outgoing/Incoming Dependency Edges: sometimes it's useful to see both the incoming
and outgoing dependency edges, this is a shortcut for the combination of the previous two actions.
It just works in the System Complexity View, given that the
other polymetric views already contain this information.
Show Incoming Dependency Edges: this action works like the previous one, except that here the
dependencies are the incoming ones, that is: there will be an arrow from every class that uses
some method implemented in the selected class(es). It just works in the System Complexity View, given that the
other polymetric views already contain this information.
Show Outgoing/Incoming Dependency Edges: sometimes it's useful to see both the incoming
and outgoing dependency edges, this is a shortcut for the combination of the previous two actions.
It just works in the System Complexity View, given that the
other polymetric views already contain this information.
 Show Incoming or Outgoing Interface Edges: this action is responsible for two things and depending on the situation
it will behave as follows:
Show Incoming or Outgoing Interface Edges: this action is responsible for two things and depending on the situation
it will behave as follows:- the selected class is an interface: the plug-in will create links between this interface and all the classes that are implementing the interface.
- the selected class is not an interface: the plug-in will create links between this class and all the interfaces that it's implementing.
 Hide Given Edges..: this action is responsible for displaying a panel where the user can
hide and filter dependency edges that are currently shown in the
polymetric view, depending on a show-range or hide-range. The show-range allows the user to enter in a text field
a range in the format X-Y, and the plug-in will show only dependencies fitting that range. The user could also use
the slider at the bottom of the panel to hide dependencies that have a weight smaller than the selected value.
Hide Given Edges..: this action is responsible for displaying a panel where the user can
hide and filter dependency edges that are currently shown in the
polymetric view, depending on a show-range or hide-range. The show-range allows the user to enter in a text field
a range in the format X-Y, and the plug-in will show only dependencies fitting that range. The user could also use
the slider at the bottom of the panel to hide dependencies that have a weight smaller than the selected value. Select Polymetric View (group): Through this group icon the user will be able to switch between the 3 polymetric views
as follows:
Select Polymetric View (group): Through this group icon the user will be able to switch between the 3 polymetric views
as follows:
Shows the System Complexity View
 Shows the Class Dependency View
 Shows the Package Dependency View
Polymetric Views
X-Ray provides 3 different polymetric views. A polymetric view is a view that provides an abstraction of the project, using different metrics to represent the underlying system. Edges and Nodes are the bricks that compose every view and all of them have an associated tooltip that describes them. To see the tooltip just place your mouse pointer over an entity.

System Complexity View
The System Complexity View is the default polymetric view that appears to the user right after he/she selected a project as target for X-Ray.
The System Complexity View is particularly efficient while spotting disharmonies in the design and implementation of a system. It is easy to find and identify big nodes (compared to the others) or anomalies in the shape of the project (provided by the inheritance tree). The user is therefore able, with a single picture, to analyze and understand complex systems in terms of methods, lines of code and inheritance hierarchies without the need of reading source code. The System Complexity View highlight symptoms of identity disharmonies that can be noticed by considering design elements in isolation.
The metrics are the following:
Position Metrics
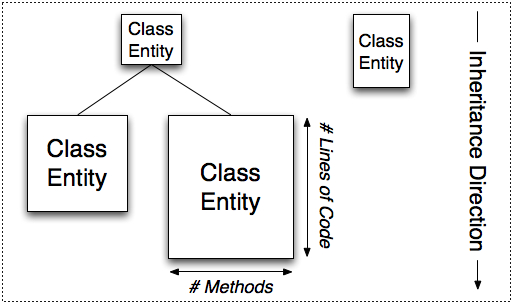
Nodes are rectangles that model classes of the underlying system (the width of a rectangle represents the number of methods implemented in that class, while the height of the rectangle represents the number of lines of code of the whole class). Edges represent inheritance between classes. Nodes are arranged in vertical (top-down) trees that highlight inheritance hierarchy.
Every node can have a different body color, as follows:
 Dark Blue implies a concrete class.
 Light Blue implies an abstract class.
 White implies an interface.
 Green implies an external class. By external class we mean a class that is
external to the project, while some
internal classes are inheriting from it.
Green implies an external class. By external class we mean a class that is
external to the project, while some
internal classes are inheriting from it.
 Light Gray implies an abstract inner class.
 Dark Gray implies a concrete inner class.
In the next releases users will be able to load and save their own color schemas.
This is how X-Ray visualizes Azureus 3.0 (more than 500.000 lines of code!) with a System Complexity View:
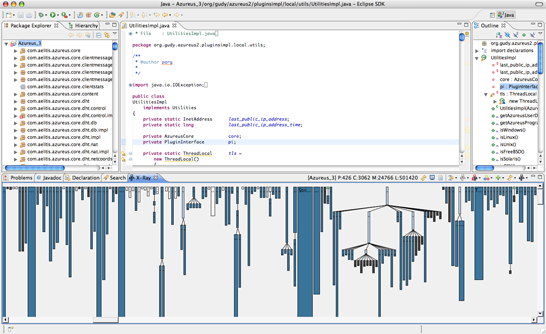
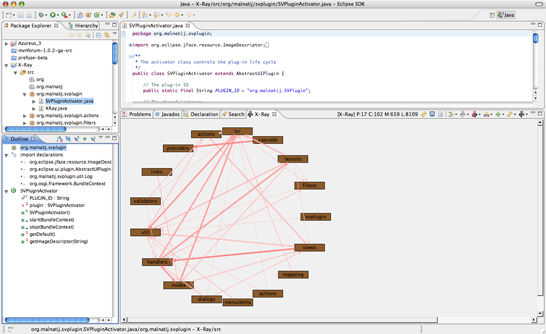
While the following is is the System Complexity View of X-Ray itself, overlaying the outgoing and incoming dependencies (the pink and red arrows) for the abstract class PolymetricViewHandler, drawn inside the workbench view created by the plug-in:
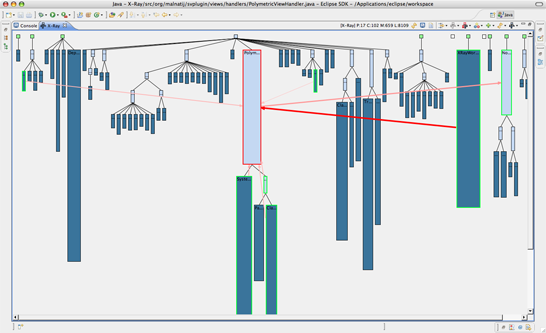
X-Ray has a particularly useful feature: double-clicking on a class entity, the plug-in will show in the code editor the source code of that class and moreover it will display all the outgoing dependencies for that class. At the same time, every time a user switches between source code tabs (in the editor every tab corresponds to a compilation unit, aka a .java file), X-Ray will select the entity modeling that class, centering its workbench view on that node and providing its outgoing dependencies. This automatic feature avoids to get lost in the code without being able to put the class that we are currently browsing inside its context (in terms of hierarchy trees and dependencies).
Class Dependency View and Package Dependency View
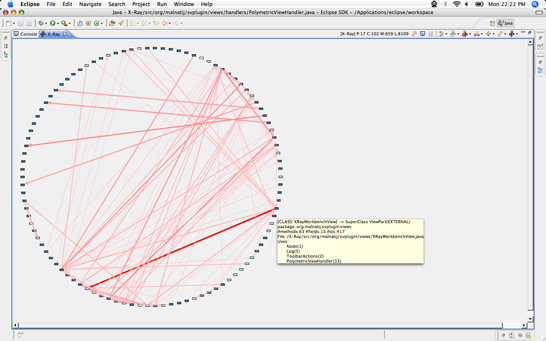
Arranged in a bi-dimensional circle, classes and packages are linked together by dependency links, each of them with a certain weight, highlighting how strength is the dependency between entities. We say that a class has a dependency when the class uses some code implemented by another class. The darker and larger is the arrow between two nodes, the stronger is the dependency.
This visualization highlights design defects, providing information about coupling and cohesion (making it easier, for example, to decide where and when to use a design patter such as facade). Class and Package Dependency Views highlight disharmonies that affect several entities at once in terms of the way they collaborate to perform a specific functionality.
The following is the Class Dependency View of the plug-in code itself:
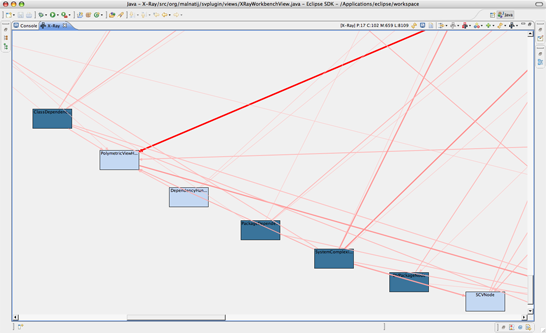
While the following is a detail of the previous Class Dependency View, after zooming on some interesting node.
The following is the Package Dependency View of the plug-in code itself:
While the following is an unfiltered particular of the Package Dependency View of Azureus 3.0 (therefore it contains all the dependencies)
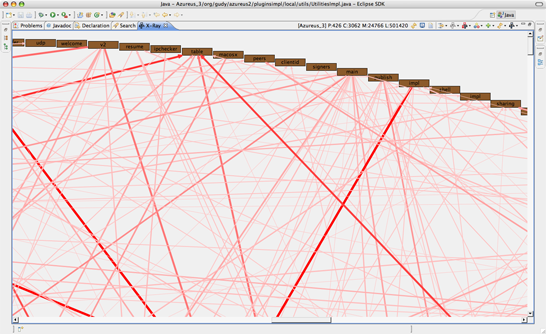
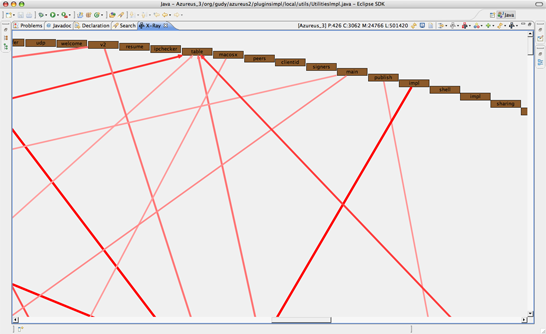
As you can see the previous visualization it's (quite) a useless mess, but it starts being useful as soon as we filter out some dependency edges (in this case, the ones with less than 30 as weight)
Conclusions
With the System Complexity View, the user can spot identity disharmonies and identify design issues only by looking at the shape of the visualized system. With the Class and Package Dependency Views the user can spot collaboration disharmonies and identify incoming and outgoing dependencies. Exploiting the abstractions provided by all the three polymetric views, the user can analyze any system at class and package level, deepening his knowledge browsing dependencies and hierarchies
Future (and current) Work
I'm actually working on the plug-in and I'll do it for the whole summer 2007. Stay tuned for the next release! it will hopefully provide:
- context menu for the figures
- status bar
- information pane
- spawning
- moving
- composite figures
- preferences dialog
Known Bugs
Nobody is perfect and my tool is far away from being bug free :p
The following is a list of known bugs, I'm currently working to fix them:
- Zooming doesn't work properly in the Class and Package Dependency View (under certain circumstances)
Stay tuned!
Related Works
As far as I know, more than 30 developers are using some of my code. From version 1.0.4 on, the functionalities of X-Ray's model can be directly used through plug-in dependencies (there will be soon a tutorial).
Andrea Casarella has been the first plug-in developer to integrate and exploit
X-Ray's model (soon there will be a tutorial about using and extending my model).
(from its official website)
"The goal of Proximity Alert is to create an open-source plug-in for Eclipse that
allows programmer to see and to be warned if code modification could compromise
the system functioning. The scope of the system is to simplify by using a graphical
support the work of the developers that will be totally guided through the system,
its entities and warned if modifications in one of them could affect the correct
functioning of it."
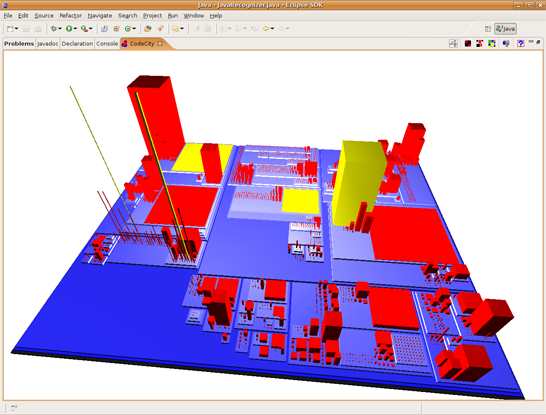
Citylyzer is a 3D visualization plug-in created by Andrea Biaggi, on top of X-Ray. It exploits X-Ray's model creation in order to visualize the underlying code.
(from its official website) Citylyzer is a 3D visualization tool that uses a city metaphor (like the well known CodeCity) to represent the code: classes are buildings and packages are districts.
Please contact me for any question, issue or request.

This work is licensed under a
Creative Commons Attribution-Noncommercial-Share Alike 3.0 Unported License.


